Features
Education
How-to
Management
Tracking production metrics with Excel
December 17, 2019 By The experts at the Freshwater Institute
 (Image courtesy of the Freshwater Institute)
 By pairing records of water quality, feed rates and fish numbers with results from scheduled fish sampling events in Microsoft Excel, RAS managers can efficiently monitor fish performance metrics. Accurate fish performance metric summaries alert managers and operators to underperforming tanks and create a data record to guide future fish growth projections and management.
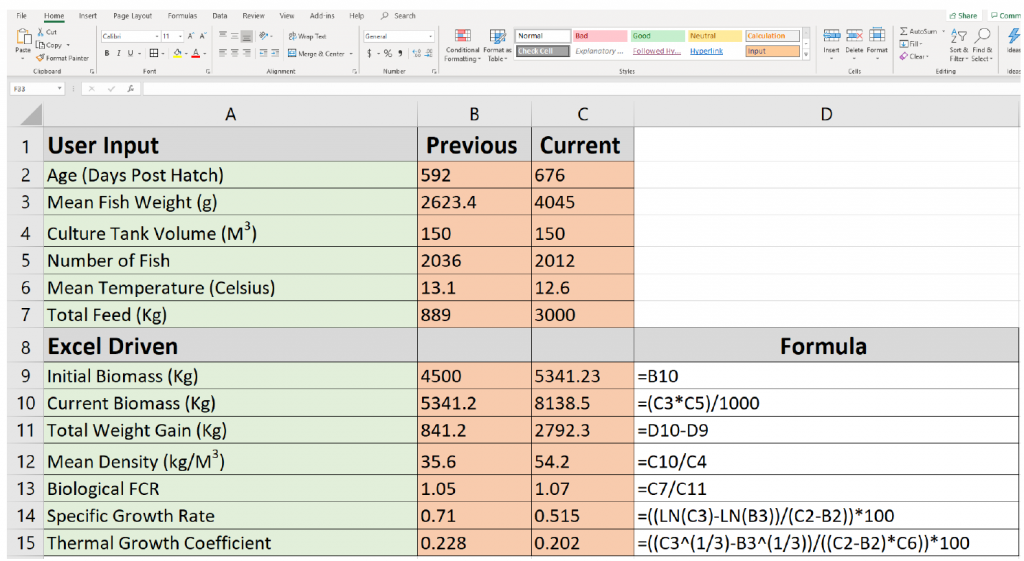
The image here is a sample of an Excel spreadsheet used to monitor key fish production metrics. The following provides and explanation of the Excel entries and how you can use them at your facility.
Basic inputs
Mean temperature, and the total amount of feed offered during a sampling period are inputs required to calculate basic performance metrics. Additionally, a starting point or previous mean weight is needed. Previous mean weight is the average weight of the fish in grams at a prior sampling event. Each time fish are sampled, the current mean weight can be entered with the current number of fish in the tank to provide the final data inputs for fish performance equations. Include fish age in days post hatch at each sampling entry for easy calculations of sampling period length.
Biomass
Biomass refers to the total weight of the fish in the tank and initial or current biomass in Kg can be calculated with the following Excel formula:
=(previous or current fish weight*number of fish)/1000
To determine total weight gained in a sampling period, find the difference of the current biomass and the initial biomass with the following Excel formula:
=current biomass – previous biomass
Knowledge of the current biomass helps measure progress toward production goals and helps to estimate required feed, oxygen, and/or water flow inputs.
Biomass density
Calculations of biomass are important inputs for other performance metrics, such as biomass density, which is calculated as follows in Excel:
=current biomass/culture tank volume
Regularly checking biomass density ensures tanks are not becoming over-crowded, which can cause fish health and welfare issues. Biomass density is also informative data for the facility bio plan and guides scheduling of fish move or harvest events.
Feed conversion ratio
Feed Conversion Ratio (FCR) is an important metric for managers and operators to monitor as feed is the primary production cost for RAS facilities. High FCRs may indicate a problem with fish performance, environment, or feed formulation. To calculate FCR is Excel, use the equation:
=total feed offered/total weight gained
Managers should expect FCR to increase as fish grow larger. Historic data can help project feed demands of fish at different life stages and sizes. Typical FCR values observed at the Freshwater Institute are 0.95, 1.05, and 1.17 for Atlantic salmon fry, smolt and grow-out stages, respectively.
Specific growth rate
Specific growth rate (SGR) Specific growth rate (SGR) is calculated in Excel using the equation:
=((LN(current fish weight)-LN(previous fish weight))/(current age-previous age))*100
Specific growth rate is a measure of percent body weight gain per day. In addition to its use in growth performance tracking, SGR can be used to accurately increase daily feed rations to satiate a growing biomass. Managers should be aware that SGR can change based on fish size or life stage, but generally decreases during grow-out to market size.
Thermal growth coefficient
Thermal growth coefficient (TGC) is a growth rate model corrected for temperature, where the growth of fish reared at different water temperatures can be more closely compared. To calculate TGC in Excel use the formula:
=((current fish weight^(1/3)-previous fish weight^(1/3))/((current age-previous age)*mean temperature))*100
Like SGR, fish of different sizes can have very different TGC values. Building a historical data set of TGC values for fish of different sizes, grown at different temperatures, can help managers project fish growth based on environmental factors to more accurately estimate time to reach growth goals. Typical TGC values observed at the Freshwater Institute are 0.137, 0.201, and 0.172 for Atlantic salmon fry, smolt and grow-out stages, respectively.
Formula fields can be programmed with cell references to automatically calculate core production metrics from entered data and dragged to populate the next cell with each new data point. Be sure data is entered in correct units and add conversions where necessary. Additionally, make sure that syntax, parentheses locations, and cell references are correct.
Growth projections can become invalid when unexpected biological factors impact fish growth. Accordingly, managers should consider adding safety factors or projecting a best and worst case estimate when forecasting fish growth.
Print this page