Features
Sponsored Content
Management
Monitoring performance of a water treatment system: Fish tank
October 1, 2021 Sponsored by by Blue Unit ![]()
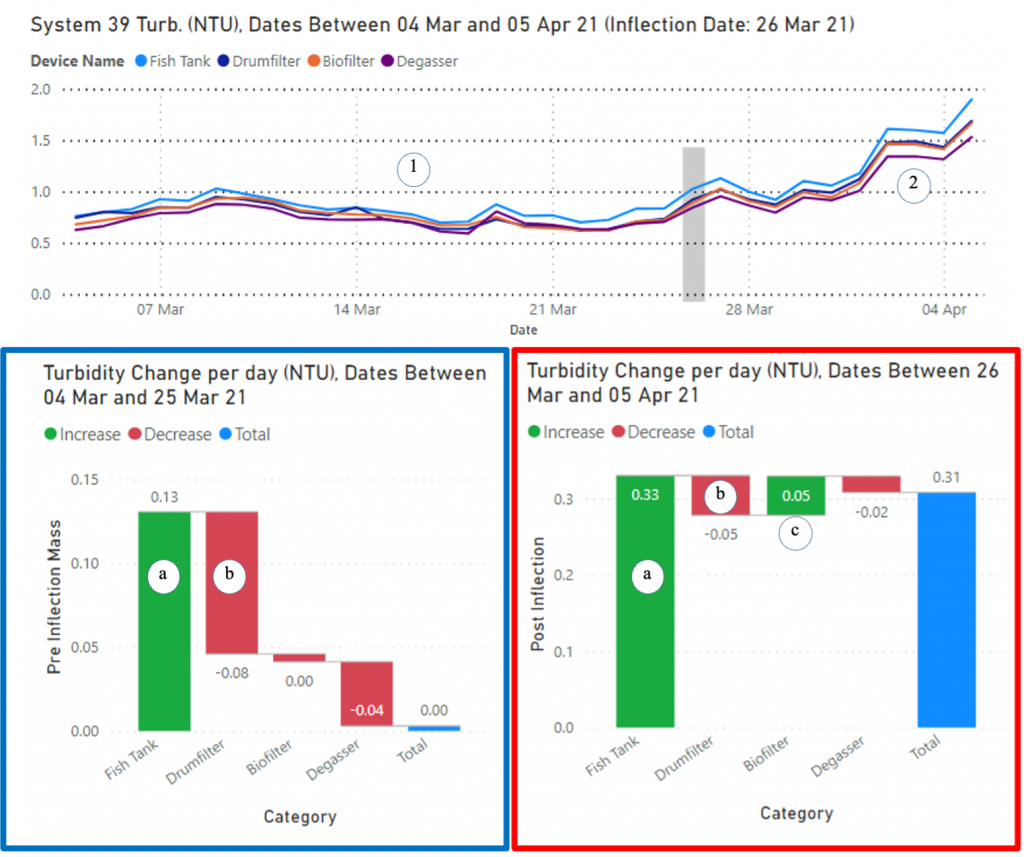 Photo: Blue Unit
 Blue Unit has introduced its Perform-o-Gram diagram, made to show how turbidity is shifting around a recirculating aquaculture system (RAS) farm.
The Perform-o-Gram redline for the fish tank crosses the upper outer limit at point (a) below, giving a performance alert. The software tooltip explains that the amount of turbidity that has passed through the fish tank on this day is significantly different from the previous days. An auto-generated description explains how the fish tank had been performing earlier (b) and suggests potential causes for the process change (c).
Following the alert, the operator can access more detailed software tools to understand the cause for the change. In this case “candle charts” clearly indicated that a change in feed type and feeding regime were responsible for poorer tank self-cleaning up to and after the alert date.
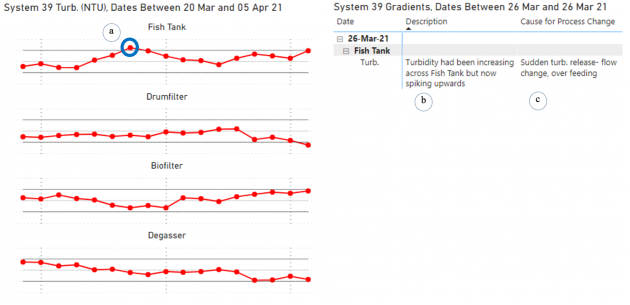
Photo: Blue Unit
But how did poorer self-cleaning by the fish tanks impact the rest of the RAS farm? A mass balance that determines how much turbidity was shifted by each device per day, clearly indicates the effect.
The top graph of the below figure A shows the turbidity time series for the RAS farm. In period (1) a stable turbidity level persisted, until the grey bar (fish tank performance alert). Thereafter turbidity rapidly increased – period (2).
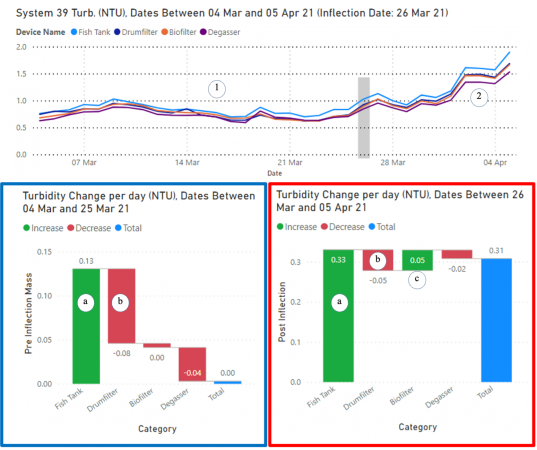
Photo: Blue Unit
The bottom graphs showing mass balance for the days before, blue box, and the says after, red box. In the period before the alert, blue box, the turbidity was 0.13 NTU passing across the fish tank. In the period after the alert, red box, the turbidity was 0.33 NTU. This is more than twice the previous level.
Mass balance shows that drumfilter performance also reduced from removing -0.08 NTUs before, to removing -0.05 NTUs after (b). The biofilter also began to lose particles following the change in fish tank performance (c).
From the overall pattern, the change in fish tank performance meant particles stayed longer within the fish tank, creating additional fine colloids that pass more readily through the water treatment devices, contributing to a general increase in system turbidity.
Print this page